Motionprint Ergo ships with a ready-made Power BI report that connects to your saved project data and gives you a single, aggregated view across every assessment — risk level by methodology and status, tag and demographic breakdowns, and trends over time. This article covers opening the report, connecting it to your data, and what each sheet shows.
1What Is Power BI Reporting?
Every assessment you save to the Projects Database lives in Motionprint Ergo's local database on this computer. The Power BI report reads that data directly and turns it into a three-sheet report: an overview of assessment volume, status and risk level over time; a breakdown by tag with full assessment details; and a demographics view plotting subject age, height and weight against risk score for each methodology (RULA, NIOSH, KIM-LHC).
The report opens in Microsoft Power BI Desktop, a free application from Microsoft. If you don't have it installed yet, get it from the Microsoft Store or powerbi.microsoft.com before continuing.
The data behind this report is private to this installation — it reads your own computer's local Projects Database directly and nothing is sent anywhere else. If your organisation saves projects on more than one computer today, each one has its own separate report for now.
2Opening the Report
The report template is bundled with the app and opens with a single button on the Database screen:
- Make sure Motionprint Ergo is open and running. The report connects to a small backend service that starts automatically with the app, so there's nothing separate to start.
- Click Database in the sidebar.
- Click Open Power BI Template, next to the existing project actions. This launches the bundled report template directly in Power BI Desktop.
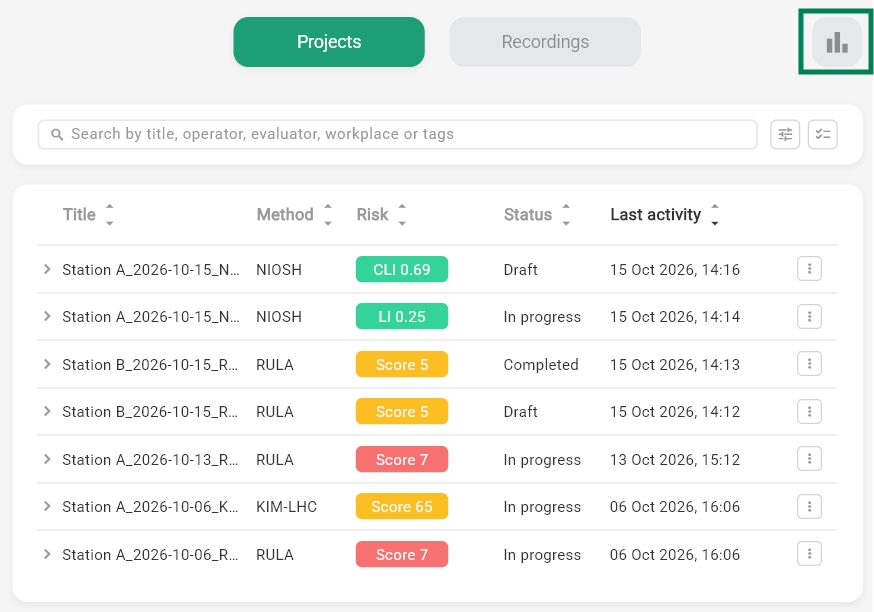
If Power BI Desktop isn't already open, Windows launches it for you as soon as you click the button.
3Connecting to Your Data
The first time you open the template, Power BI asks for one parameter before it can load anything:
- When prompted for BackendUrl, enter http://127.0.0.1:8000 — this points the report at the backend running locally on your own computer.
- Click Load. If Power BI asks which credentials to use for this source, choose Anonymous.
- Power BI pulls in your saved assessments. Depending on how many projects you have, this can take anywhere from a few seconds to about a minute.
Power BI remembers the BackendUrl value you entered. On future refreshes (see below) you won't be asked again, unless you reinstall Power BI Desktop or open a fresh copy of the template.
4Understanding the Dashboard
The report opens with three sheets, shown as tabs along the bottom of the Power BI window: Overview, By Tag, and Demographics.
Overview
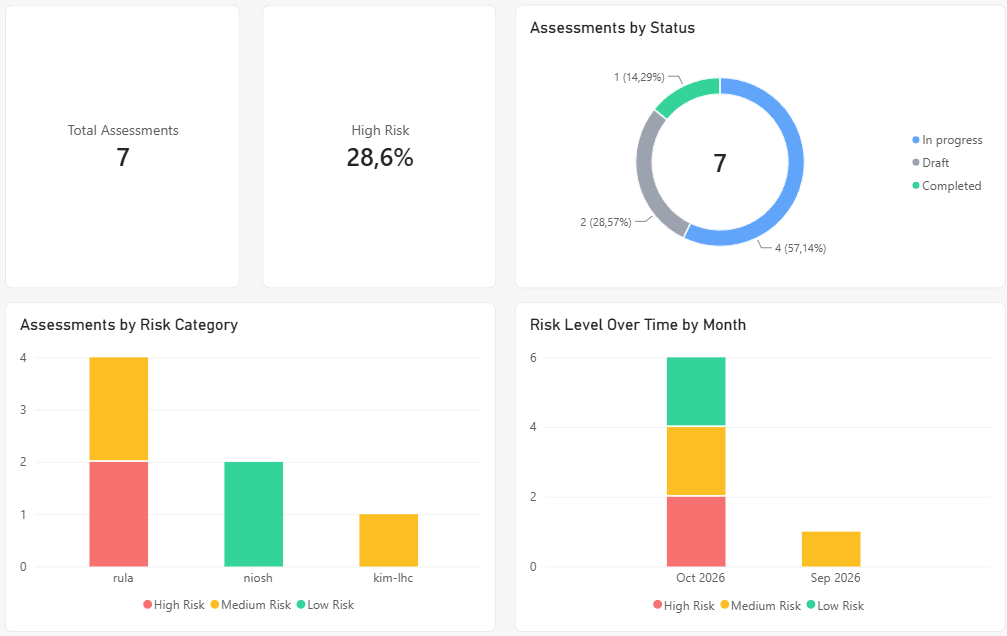
The first sheet gives you the big picture across every loaded assessment:
- Total Assessments and % High Risk — headline summary cards.
- Assessments by Status — how many are Draft, In Progress, or Completed.
- Assessments by Risk Category — the Low/Medium/High split, per methodology.
- Risk Level Over Time — a monthly trend of risk levels.
By Tag
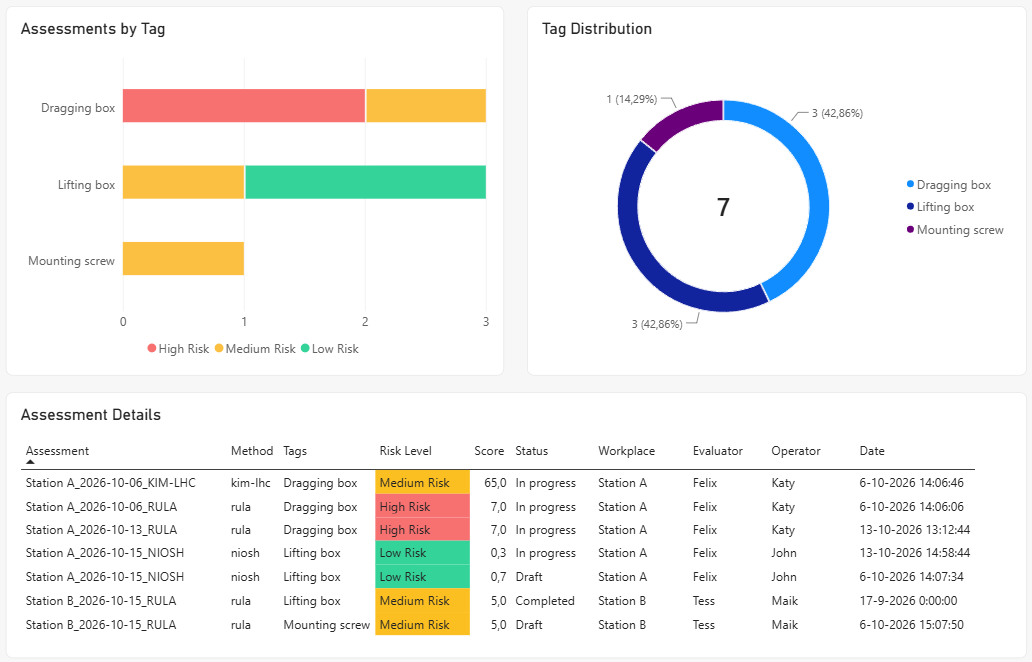
The second sheet breaks the same data down by the tags you've added to your projects:
- Assessments by Tag — how many assessments carry each tag.
- Tag Distribution — the relative share of each tag.
- Assessment Details — a filterable, sortable table listing every loaded assessment.
Demographics
The third sheet plots subject demographics against risk, split out per methodology: nine scatter plots in total — age, height, and weight, each against risk score, for RULA, NIOSH, and KIM-LHC individually.
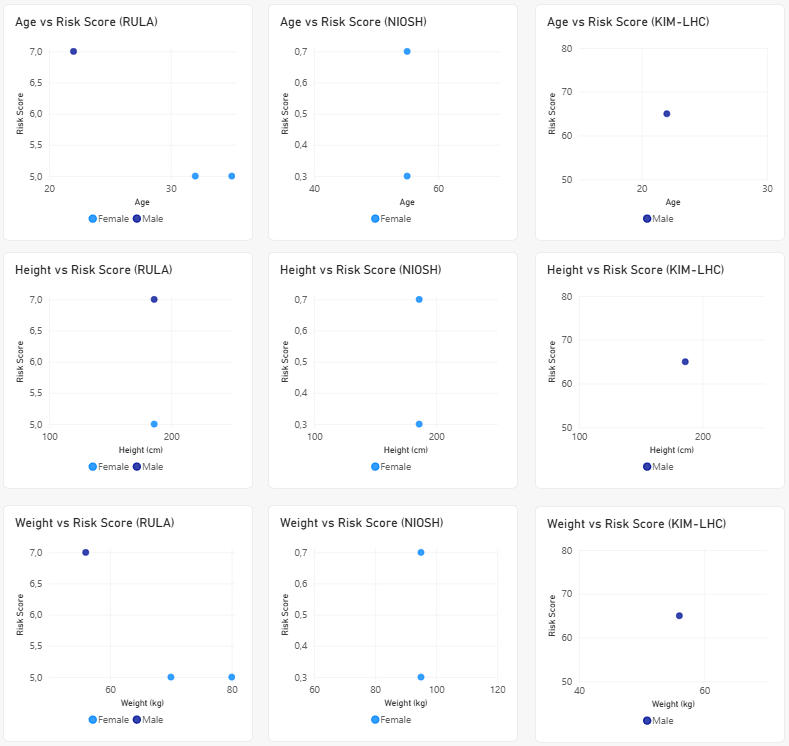
Every chart and table across all three sheets respond to the filters along the side of the report — filter by workplace, methodology, status, or date range to narrow the view down to what you're interested in.
5Refreshing & Troubleshooting
Click Refresh on the Home ribbon in Power BI Desktop at any time to pull in any projects you've saved since you first opened the report.
The backend that serves the report runs only while the app is open, and shuts down when you close it. If a refresh fails with a connection error, open Motionprint Ergo first, then refresh again.
Common issues
- Power BI shows a connection error — Motionprint Ergo isn't currently open. Open the app and refresh again.
- The report loads but looks empty — the report only includes assessments that have been saved to the Projects Database; an assessment that's still open and unsaved won't appear yet.
- I don't see projects saved on a colleague's computer — by design, for now. Each installation's report only reads that computer's own local database; see the note at the top of this article.
Once connected, this report stays available in Power BI Desktop like any other — pin it, build your own visuals on top of it, or schedule refreshes if you publish it to the Power BI service. See Projects Database for how saved projects and their status feed into this report.