Once a NIOSH assessment is complete in Motionprint Ergo, the results are presented in a structured report with up to three tabs. This article walks through every element in the results view — what each section shows, how to read it, and how to use its interactive features — so you can get the most out of every assessment.
Report structure
The report opens with a tab bar at the top. Depending on your NIOSH report settings, you will see two or three tabs:
- Score Overview — the complete assessment result: scores, multiplier breakdowns, and the position data at the key frame.
- Analysis — an interactive deep dive into how each variable behaves frame by frame across the entire lift.
- Findings — a free-text documentation area for recording your observations and recommendations. This tab only appears if it is enabled in the NIOSH report settings.
Next to the tabs are two buttons: Edit (to update general information such as workplace, evaluator, and comments) and Export (to generate a PDF or Excel file of the full report).
If your assessment contains two or more lifting tasks, a task selector appears at the top of the Score Overview and Analysis tabs. Use it to switch between individual tasks or (on Score Overview) the CLI Overview, which shows the aggregated Composite Lifting Index across all tasks. See the Understanding the NIOSH Assessment article for details on how the CLI is calculated.
1 Score Overview
The Score Overview tab gives you everything a standard manual NIOSH assessment would produce, presented in a clean, structured layout. It is the primary result page — the one you share with a client or include in a report.
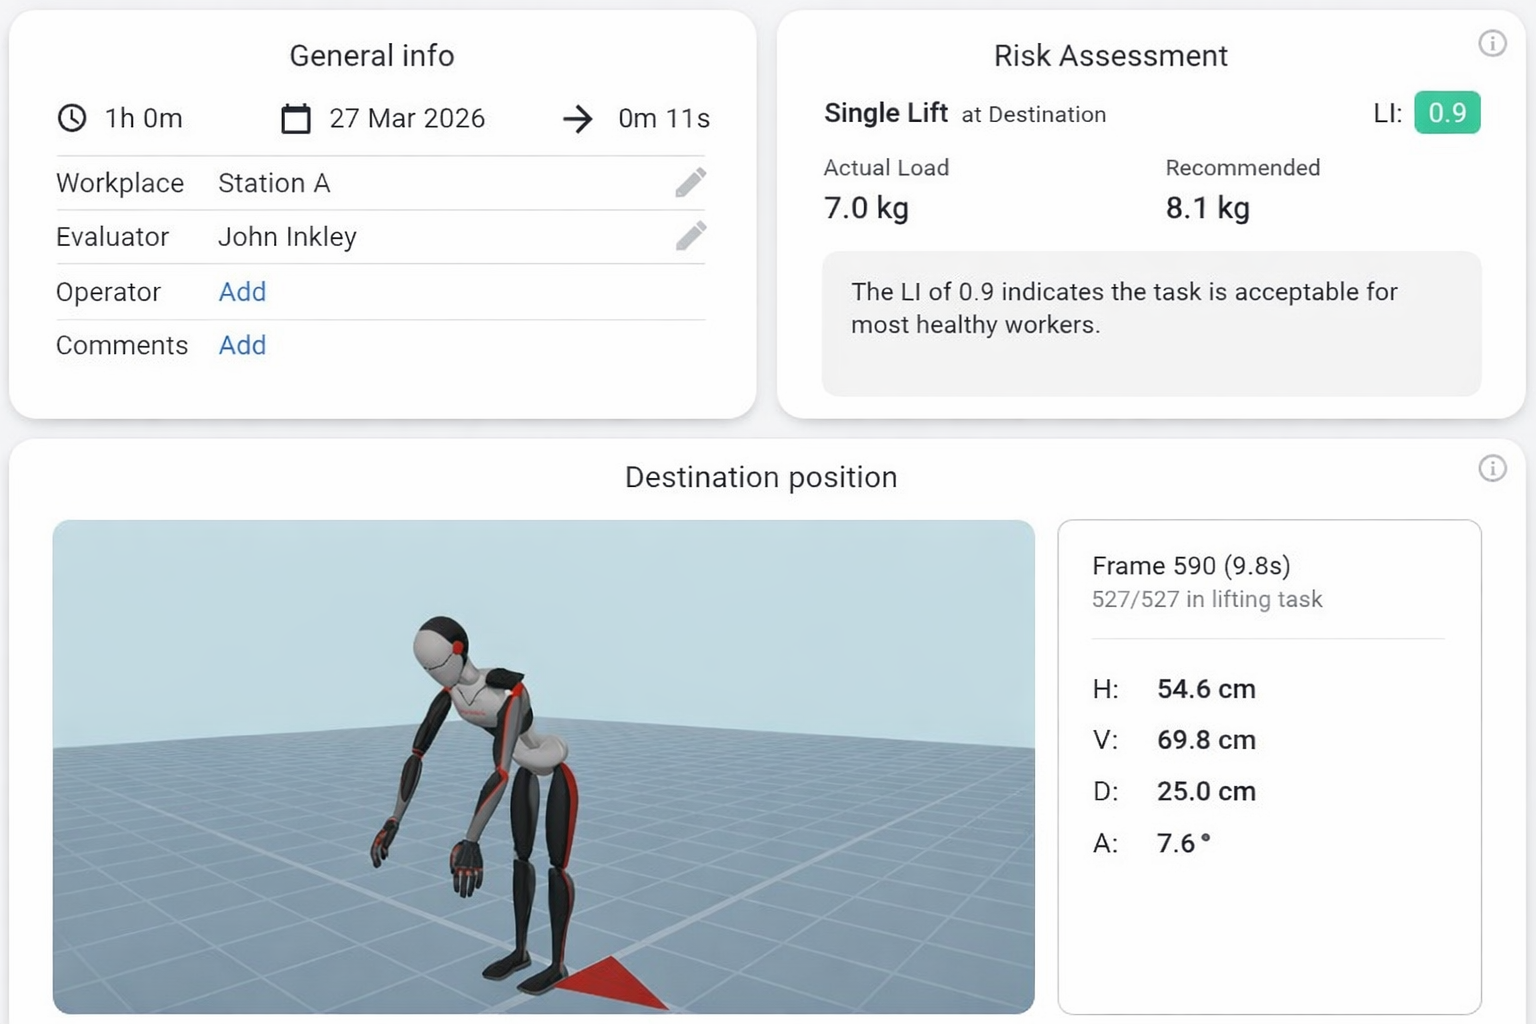
General information card
The top-left card displays metadata about the assessment session. All fields can be edited inline by clicking the Edit button at the top of the report.
| Field | Description |
|---|---|
| Working time | Total time spent at the workstation (e.g. "2 h 15 min"). |
| Date | The evaluation date. |
| Cycle duration | Duration of one repetitive lifting cycle, used to derive lift frequency. |
| Workplace | Name or description of the assessed workstation. |
| Evaluator | The person performing the assessment. Hidden if the privacy setting "Hide evaluator name" is enabled. |
| Operator | The worker being assessed. Hidden if "Hide operator name" is enabled. |
| Comments | A free-text field for any additional context about the assessment. |
Risk assessment card
The top-right card shows the primary risk result. Its content adapts depending on whether the report is single-task or multi-task.
Single-task view
- A label identifying the assessed frame (e.g. "Single Lift at Frame 120").
- A colour-coded LI badge — green (≤ 1.0), orange (1.0–3.0), red (> 3.0).
- The actual load weight and the Recommended Weight Limit (RWL) side by side.
- A short sentence interpreting the risk level in plain language.
- A warning if the Frequency Multiplier equals zero, meaning the lift frequency exceeds NIOSH limits.
Multi-task — individual task view
- Two colour-coded badges: STLI (Single-Task Lifting Index) and FILI (Frequency-Independent Lifting Index).
- Three weight figures: actual load weight, STRWL (single-task RWL), and FIRWL (frequency-independent RWL).
Multi-task — CLI Overview
- The total number of lifting tasks and a colour-coded CLI badge.
- Identifies the highest-risk task (Task 1 by STLI rank) and its load weight.
Peak moment screenshot and position data
Below the two cards, the main area shows a screenshot of the 3D avatar at the key frame of the lift — the peak moment frame (or origin/destination frame, depending on the analysis mode set in NIOSH report settings). Alongside the screenshot, a data panel shows:
- The absolute frame number and its timestamp within the recording.
- The relative position within the lifting task (e.g. "45/120 in lifting task").
- The four biomechanical variables at that frame: H (cm), V (cm), D (cm), A (°).
Frequency and coupling tables
Below the screenshot, the layout splits into two columns.
The left column shows the Frequency Multiplier (FM) lookup table for the applicable shift duration. The row matching the task's calculated frequency is highlighted with a colour-coded badge, making it easy to see exactly which FM value was applied.
The right column shows the Coupling Multiplier (CM) table with rows for Good, Fair, and Poor coupling quality, each split by vertical hand height (V < 75 cm or V ≥ 75 cm). The cell matching the task's coupling selection and V value is highlighted.
Calculations breakdown
Still in the right column, below the CM table, is a full step-by-step derivation of the result, organised into four expandable sections:
- Multiplier derivations — each of the four motion-derived multipliers (HM, VM, DM, AM) with its formula, the substituted values at the key frame, and a colour-coded risk dot indicating input quality.
- RWL calculation — the complete formula with all seven multipliers and any additional modifiers (Pf, Tf, Of, eM) substituted in, followed by the numerical result. In multi-task mode, an additional row shows the FIRWL calculated with FM = 1.0.
- LI calculation — LI = Load Weight / RWL with the colour-coded result. In multi-task mode, additional rows show the STLI and FILI.
- Error state — if lift frequency exceeds NIOSH limits (FM = 0), all calculation sections switch to red borders and display "N/A".
CLI Overview (multi-task only)
When "CLI Overview" is selected from the task selector, the main area is replaced by a dedicated CLI breakdown:
- Frequency Multipliers section — shows how individual task frequencies are summed cumulatively and the corresponding FM value for each cumulative level.
- ΣΔLIᵢ section — shows the incremental ΔLI contribution of each task from Task 2 onward.
- CLI result — the final CLI value with a colour-coded badge and the summary formula CLI = STLI₁ + ΣΔLIᵢ.
- Task breakdown table — all tasks ranked by STLI, showing STRWL, FIRWL, STLI, FILI, and ΔLI for each. A summary row at the bottom shows the STLI₁ and the ΣΔLIᵢ total.
2 Analysis
The Analysis tab is where you go beyond the single-frame result and explore how risk evolves across the entire lifting movement. It is built around an interactive 3D viewer and a frame-by-frame score graph.

Variable selector
At the top of the tab, a Select variable dropdown lets you choose which value to inspect across the recording. Changing the variable updates the graph, the frame insights panel, and the zone distribution chart simultaneously. Options:
- LI (single-task) or STLI (multi-task) — the Lifting Index per frame.
- H (horizontal) — horizontal hand distance from the midpoint between the ankles (cm).
- V (vertical) — vertical hand height above the floor (cm).
- A (asymmetry) — trunk twist angle from the worker's midline (°).
3D viewport
The interactive 3D viewer renders the motion capture data on an avatar model, constrained to the frame range of the selected lifting task. You can orbit the camera freely with the mouse. Four camera presets — Perspective, Front, Side, and Top — are accessible via an overlay in the top-left corner of the viewport.
You can toggle body risk indicators on and off using the icon button to the left of the score graph (not the viewport itself). When enabled, colour-coded spheres appear on the 3D avatar at the shoulders, wrists, and trunk/back. The sphere colours reflect the risk level for the currently selected variable at the current frame — green for low risk, orange for medium risk, and red for high risk — using the same zone thresholds as the score graph. The indicators update in real time as you scrub through frames.
Score-per-frame graph
Below the viewport, a full-width graph traces the selected variable's value across every frame in the lifting task. The graph background is divided into colour-coded risk zones that depend on which variable is selected:
| Variable | Risk zones |
|---|---|
| LI / STLI | Green 0–1.0 Yellow 1.0–2.0 Red 2.0–3.0+ |
| H | Green ≤36 cm Orange 36–52 cm Red >52 cm |
| V | Red <20 cm Orange 20–40 cm Green 40–110 cm Orange 110–130 cm Red >130 cm |
| A | Green 0–45° Yellow 45–90° Red 90–135° |
A vertical line marks the current frame position. Click or drag anywhere on the graph to scrub to that frame — the 3D viewport updates in sync. To define a custom critical moment, drag to select a frame range on the graph; an Add (+) button appears once a range is selected, which creates the moment and adds it to the critical moments list.
Playback controls sit in a vertical stack to the left of the graph: a play/pause button and a speed selector (0.5×, 1×, 1.5×, 2×).
Frame insights panel
A fixed panel to the right of the viewport shows three sections that update as you scrub through frames:
Current frame data
Shows the numerical value of the selected variable at the current frame (with its unit), the corresponding NIOSH multiplier value (e.g. "HM: 0.893"), and a visual bar divided into the same risk zones as the graph — with a dot indicating where the current value falls. If the value has been clamped per NIOSH rules (e.g. H capped at its 25 cm minimum), both the original and clamped values are shown.
Zone distribution
A pie chart showing what percentage of the lifting task's frames fall into each risk zone for the selected variable. This is an aggregate across the entire task and does not change as you scrub — it gives you an at-a-glance sense of how much of the lift was spent in each risk category.
Critical moments
Critical moments are significant instants or periods in the lift that are worth highlighting. They appear as markers on the graph and are listed in this panel. There are three types:
- Peak moment — auto-detected: the single frame with the highest LI/STLI in the task.
- Sustained risk period — auto-detected: a consecutive frame range where the score consistently exceeds a risk threshold.
- Custom moments — user-created markers at a specific frame or frame range, with a user-provided description. Create one by dragging a range on the graph and clicking the Add (+) button.
Clicking a moment in the list jumps to that frame. Double-clicking opens an edit dialog to change the frame range or description. You can also drag the edges of a period moment on the graph to resize it. Critical moments are included in the exported report.
Switch between variables (H, V, A, LI) to understand which factor is driving the risk score at each point in the lift. A frame that scores poorly on LI might be caused by a high H, a low V, or a large A — the zone distribution and graph together make this immediately visible.
3 Findings
The Findings tab is a free-form documentation area where you record your professional assessment of the results. It only appears if it is enabled in the NIOSH report settings.
Default structure
The tab displays a vertical stack of section blocks, each with a title and a multi-line text area. If you have not customised the sections, the five defaults are:
- Current Situation
- Observations
- Risk Assessment
- Recommendations
- Conclusion
Customisation
The entire Findings structure is configurable from the NIOSH report settings page:
- Enable or disable the Findings tab entirely.
- Rename the tab (default: "Findings", max 50 characters).
- Add, rename, reorder, or delete individual sections using a drag-and-drop list.
- Reset to the five defaults at any time.
Content entered in the Findings tab is kept in memory for the current session. It is included when you export the report to PDF or Excel, but it is not saved to disk automatically between sessions. Make sure to export before closing the report if you want to preserve your findings.
Export
The Export button in the tab bar generates a complete report file. The available formats and the filename template are configurable in the NIOSH report settings. The exported file includes all three tabs:
- All Score Overview data — general information, scores, multiplier breakdowns, and the CLI overview if the assessment is multi-task.
- The Analysis data — frame-by-frame values, the score graph, zone distributions, critical moments, and the peak frame screenshot.
- The Findings content with its full section structure (if the Findings tab is enabled).