Once a KIM-LHC assessment is complete in Motionprint Ergo, the results are presented in a structured report with up to three tabs. This article walks through every element in the results view — what each section shows, how to read it, and how to use its interactive features — so you can get the most out of every assessment.
1 Report structure
The report opens with a tab bar at the top. Depending on your KIM-LHC report settings, you will see two or three tabs:
- Score overview — the complete assessment result: all component scores, color-coded risk indicators, and the final Total Score.
- In-depth analysis — an interactive deep dive into how each variable behaves frame by frame across the lifting task.
- Findings — a free-text documentation area for recording your observations and recommendations. This tab only appears if it is enabled in the KIM-LHC report settings.
Next to the tabs are two buttons: Edit (to return to the input page and update any information from the assessment — lifting tasks, trim settings, task information, and working conditions) and Export (to generate a PDF or Excel file of the full report).
If your assessment contains two or more lifting tasks, a task selector dropdown appears at the top of the Score Overview tab. Use it to switch between individual tasks. When the "Generate averaged overview" setting is enabled in KIM-LHC report settings and you have two or more tasks, an Average (all moments) option is also available. The Analysis tab shows only individual tasks — no average option there. See the Understanding the KIM-LHC Assessment article for details on multi-task scoring.
2 Score Overview
The Score Overview tab gives you the complete KIM-LHC result across all scoring components, presented in a structured layout you can read at a glance and share in a report.
Throughout the Score Overview tab, each component value is displayed alongside a color-coded risk dot: green for low risk, yellow for elevated risk, and red for high risk.
Lifting task selector (multi-task only)
When the assessment contains two or more lifting tasks, a dropdown at the top of the tab lets you switch between them. Individual task entries show the weight category and frame range for that task. The Average (all moments) option — if enabled in settings — shows the aggregated result across all tasks. In average mode, only the General information card and Total Score Summary card are displayed; all detailed component blocks are hidden, and values are shown to one decimal place.
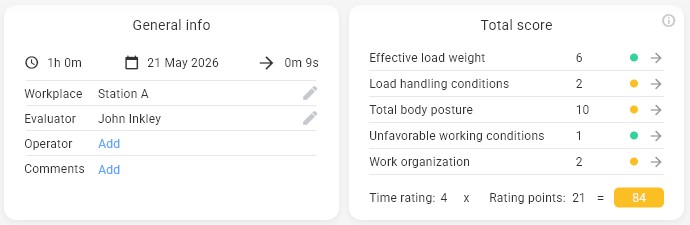
General information card
The top-left card displays metadata about the assessment session. All fields can be edited inline by clicking the Edit button at the top of the report.
| Field | Description |
|---|---|
| Workplace | Name or description of the assessed workstation. |
| Evaluator | The person performing the assessment. Hidden if the privacy setting "Hide evaluator name" is enabled. |
| Operator | The worker being assessed. Hidden if "Hide operator name" is enabled. |
| Comments | A free-text field for any additional context about the assessment. |
Total Score Summary card
The top-right card shows a summary of all five scoring components plus the final Total Score calculation. Each component row displays its value alongside a color-coded risk dot:
| Component | Green | Yellow | Red |
|---|---|---|---|
| Effective load weight | < 15 kg | 15 – 30 kg | > 30 kg |
| Load handling conditions | 0 | 2 | 4 |
| Total body posture | ≤ 8 | 9–18 | ≥ 19 |
| Unfavorable working conditions | ≤ 4 | 5–9 | ≥ 10 |
| Work organization | 0 | 2 | 4 |
Below the component rows, the card shows the calculation: Time Rating × Rating Points = Total Score, with a color-coded result badge:
| Total Score | Risk level |
|---|---|
| < 20 | Low risk |
| 20–< 50 | Slightly increased risk |
| 50–< 100 | Substantially increased risk |
| ≥ 100 | High risk |
Each component row has a navigate arrow — clicking it scrolls the page to the corresponding detail block below.
Time Rating
A full-width block shows a visual scale from 1 to 10 with the current Time Rating highlighted. An info icon explains how the Time Rating is derived from the calculated cycle frequency. For the full lookup table, see the Understanding the KIM-LHC Assessment article.
Load Rating
A full-width block shows the load rating grid, with separate columns for men and women. The weight bin matching the entered load category is highlighted, showing the effective load weight score. An info icon explains that the rating table can be customized in the KIM-LHC report settings.
Load Handling Conditions
A three-row display showing the Good (0), Restricted (2), and Unfavorable (4) options with their score values. The active row — determined by automatic analysis of the motion data — is highlighted.
Body Postures
Displayed in the left column of the detail area. A 10-row combination grid shows all possible start/finish posture pairs. The columns are labelled Start/Finish and Finish/Start to indicate that the combination is symmetric — the same score applies regardless of which posture is start vs. finish. The active combination determined by the motion analysis is highlighted. Possible scores: 0, 3, 5, 7, 9, 10, 13, 15, 18, 20.
Additional Points
Displayed in the right column, stacked above the Total Body Score. Four sub-scores are shown, each with its own value:
- Trunk twisting / side-bending — score 0, 1, or 3, derived from the percentage of frames with significant trunk rotation or lateral flexion.
- Load distance to body — score 0, 1, or 3, derived from frame-by-frame analysis of hand-to-body distance.
- Hands between elbow and shoulder — score 0, 0.5, or 1, derived from the percentage of frames with hands in this height range.
- Hands above shoulder — score 0, 1, or 2, derived from the percentage of frames with hands above shoulder height.
The four additional point values are summed, then capped at 6 points before contributing to the Total Body Score.
Total Body Score
Displayed directly below the Additional Points block. Shows the formula: Body Posture Score + Additional Points (capped at 6) = Total Body Score, with the numerical result.
Unfavorable Working Conditions
A full-width block showing all six sub-factors, each with a score value and color-coded dot. Two of these are derived automatically from the motion data; four are set manually on the input page:
| Sub-factor | Source | Score values |
|---|---|---|
| Hand/arm motion | Auto (wrist angles) | 0 / 1 / 2 |
| Force transfer | Manual | 0 / 1 / 2 |
| Adverse ambient conditions | Manual | 0 / 1 |
| Spatial conditions | Manual | 0 / 1 / 2 |
| Difficulties holding/carrying | Auto (hold duration & pelvis displacement) | 0 / 2 / 5 |
| Clothing/equipment | Manual | 0 / 1 |
The total of all six sub-factors is shown at the bottom of the block with its own color-coded dot.
Work Organization
A three-row display showing Good (0), Restricted (2), and Unfavorable (4) options. The active row — set on the input page — is highlighted.
3 Analysis
The Analysis tab is where you go beyond the summary and explore how risk variables evolve across the entire lifting movement. It is built around an interactive 3D viewer and a frame-by-frame score graph. The Analysis tab shows individual lifting tasks only — the average option is not available here.
Variable selector
At the top of the tab, a Select variable dropdown lets you choose which value to inspect across the recording. Changing the variable updates the graph, the frame insights panel, and the zone distribution chart simultaneously. Options:
- Total score — the KIM-LHC Total Score per frame.
- Load handling conditions — the load handling score at each frame.
- Trunk twisting and side-bending — trunk rotation/lateral flexion angle per frame.
- Load distance to body — hand-to-body distance per frame.
- Hand height — vertical hand position per frame.
- Hand/arm position — wrist deviation angle per frame.
3D viewport
The interactive 3D viewer renders the motion capture data on an avatar model, constrained to the frame range of the selected lifting task. You can orbit the camera freely with the mouse. In the top-left corner of the viewport you can set how many views are shown (1, 2 horizontal, 2 vertical, or 4), and per view choose from Perspective, Front, Right side, Left side, Back, and Top. For a full overview of viewport controls and navigation, see 3D View & Interface Controls.
Score-per-frame graph
Below the viewport, a full-width graph traces the selected variable's value across every frame in the lifting task. The graph background is divided into color-coded risk zones. For the Total Score, zones follow the overall risk thresholds (green < 20, green 20–50, yellow 50–100, red ≥ 100). For sub-variables, zones use green and yellow/red thresholds appropriate for that specific measurement.
A vertical line marks the current frame position. Click or drag anywhere on the graph to scrub to that frame — the 3D viewport updates in sync.
To the left of the graph you will find the play/pause button, speed selector (0.5×, 1×, 1.5×, 2×), and the body risk indicator toggle. When body risk indicators are enabled, color-coded spheres appear on the 3D avatar at relevant joint locations. The sphere colors reflect the risk level for the currently selected variable at the current frame — green for low risk, yellow for medium risk, red for high risk — using the same zone thresholds as the score graph. The indicators update in real time as you scrub through frames.
Right-side panel
A fixed panel to the right of the viewport shows three sections that update as you scrub through frames:
Frame insights
Shows the numerical value of the selected variable at the current frame (with its unit) and a visual bar divided into the same risk zones as the graph — with a dot indicating where the current value falls.
Zone distribution
A pie chart showing what percentage of the lifting task's frames fall into each risk zone for the selected variable. This is an aggregate across the entire task and does not change as you scrub — it gives you an at-a-glance sense of how much of the lift was spent in each risk category.
Critical moments
Critical moments are significant instants or periods in the lift that are worth highlighting. They appear as markers on the graph and are listed in this panel. There are three types:
- Peak moment — auto-detected: the single frame with the highest score in the task. Can be enabled or disabled in the KIM-LHC report settings.
- Sustained risk period — auto-detected: a consecutive frame range where the score consistently exceeds a risk threshold for at least 1 second. Can be enabled or disabled in settings.
- Custom moments — user-created markers at a specific frame or frame range, with a user-provided description. Create one by dragging a range on the graph and clicking the Add (+) button.
Clicking a moment in the list jumps to that frame. Double-clicking opens an edit dialog. You can also drag the edges of a period moment on the graph to resize it. All moment types — auto-detected and custom — can be edited and deleted. Critical moments are included in the exported report.
Switch between variables (Total score, load handling conditions, trunk twisting, load distance, hand height, hand/arm position) to understand which factor is driving the risk score at each point in the lift. The zone distribution and graph together make this immediately visible across the full task duration.
4 Findings
The Findings tab is a free-form documentation area where you record your professional assessment of the results. It only appears if it is enabled in the KIM-LHC report settings.
Default structure
The tab displays a vertical stack of section blocks, each with a title and a multi-line text area. If you have not customised the sections, the five defaults are:
- Current Situation
- Observations
- Risk Assessment
- Recommendations
- Conclusion
Customisation
The entire Findings structure is configurable from the KIM-LHC report settings page:
- Enable or disable the Findings tab entirely.
- Rename the tab (default: "Findings", max 50 characters).
- Add, rename, reorder, or delete individual sections using a drag-and-drop list.
- Reset to the five defaults at any time.
5 Export
The Export button in the tab bar generates a complete report file. The available formats and the filename template are configurable in the KIM-LHC report settings. The exported file includes:
- All Score overview data — general information, component scores with color indicators, Time Rating, and Total Score.
- The In-depth analysis data — frame-by-frame values, the score graph, zone distributions, critical moments, and the peak frame 3D viewport screenshot.
- The Findings content with its full section structure (if the Findings tab is enabled and content has been entered).
When "Export only average lifting task" is enabled in settings and the averaged overview is active, only the averaged data is exported instead of all individual task results. For a full overview of export formats, options, and configuration, see Exporting Reports (PDF & Excel).
6 Save to Projects Database
In addition to exporting, you can save the completed assessment to the Projects Database — a persistent local library of all your saved analyses. Click Save Project in the results tab bar to open the save dialog. From there, set a project title, choose a status (Draft, In Progress, or Completed), and add optional tags for easier filtering later.
Saving a project preserves the full assessment — including all calculation data, critical moments, settings, and metadata — so you can return to it at any point. Saved projects can be reopened, re-exported with different settings, and managed from the Database in the sidebar. See Projects Database for the full overview.