Once a RULA assessment is complete in Motionprint Ergo, the results are presented in a structured report with up to three tabs. This article walks through every element in the results view — what each section shows, how to read it, and how to use its interactive features — so you can get the most out of every assessment.
1 Report structure
The report opens with a tab bar at the top. Depending on your RULA report settings, you will see two or three tabs:
- Score overview — the complete assessment result: every component score, the three scoring tables, and the final RULA score.
- In-depth analysis — an interactive deep dive into how each measurement behaves frame by frame across the whole posture task.
- Findings — a free-text documentation area for recording your observations and recommendations. This tab only appears if it is enabled in the RULA report settings.
Next to the tabs are two buttons: Edit (to return to the input page and update any information from the assessment — posture tasks, trim settings, task information, and more) and Export (to generate a PDF or Excel file of the full report).
If the report was created from a recording, anything you change after pressing Edit applies only to this report; the recording in the Recordings Database stays as it was saved.
If your assessment contains two or more posture tasks, a Posture Task Selector appears at the top of the Score Overview and Analysis tabs. Use it to switch between individual tasks. Each task is scored independently and keeps its own peak frame. If Generate averaged overview is enabled in the settings, an Average (all tasks) option is added to the selector.
2 Score Overview
The Score Overview tab gives you everything a standard manual RULA worksheet would produce, presented in a clean, structured layout. It is the primary result page — the one you share with a client or include in a report.
General info card
The top card displays metadata about the assessment session. The text fields can be edited inline on the Score Overview, without returning to the input page.
| Field | Description |
|---|---|
| Frame | The frame with the highest (worst) RULA score — every score on this page is calculated for this frame. |
| Date | The evaluation date. |
| Cycle duration | Duration of the cycle as defined in this recording, derived from the trimmed frame range. |
| Workplace | Name or description of the assessed workstation. |
| Evaluator | The person performing the assessment. Hidden if disabled in the privacy settings. |
| Operator | The worker being assessed. Hidden if disabled in the privacy settings. |
| Comments | A free-text field for any additional context about the assessment. |
RULA score card
The score card shows the primary result: the final RULA score for the selected posture task, the frame it occurred at, and the risk band it falls into. Alongside it, a legend maps all four bands so a reader unfamiliar with RULA can place the result immediately.
| Score | Risk level | Action |
|---|---|---|
1 – 2 | Negligible risk | Acceptable |
3 – 4 | Low risk | Further investigation needed |
5 – 6 | Medium risk | Changes needed soon |
7 | Very high risk | Changes needed now |
The card also shows the distribution across the task — what proportion of its frames fell into each band. A task peaking at 6 but spending most of its frames in the 1–2 band is a very different finding from one sitting at 5–6 throughout, and the distribution is what separates the two.
Posture modules
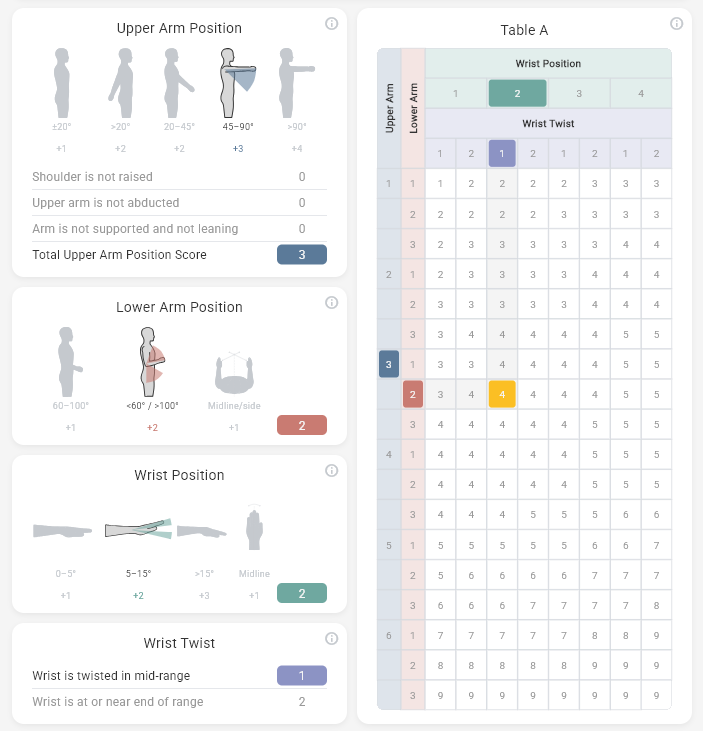
Below the score card, the assessment is laid out in the same two groups RULA itself uses. Each module scores one body part and follows an identical pattern, so learning to read one means you can read all of them.
- Group A — arm and wrist: Upper Arm Position, Lower Arm Position, Wrist Position and Wrist Twist, followed by the Wrist & Arm total.
- Group B — neck, trunk and legs: Neck Position, Trunk Position and Legs, followed by the Neck/Trunk/Legs total.
Each module shows:
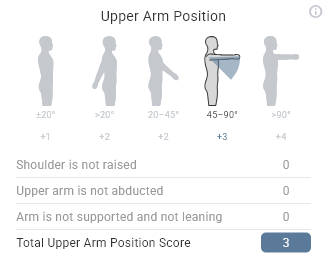
- A row of reference figures, one per scoring band, each labelled with its angle range and the points it scores.
- The band matching this task's peak frame is highlighted; the others are greyed out.
- Any adjustments that applied — twisting, side bending, abduction, a raised shoulder, arm support — listed underneath with their points.
- The module's total score on the right.
This is the fastest way to see what drove a result. If the Trunk module highlights the 20–60° figure and shows a twist adjustment, the worker was bent forward and rotated at the peak frame — and re-presenting the work would address both at once.
In the Lower Arm module the first two figures are elbow flexion bands, while the third shows the separate across-midline condition. When the hand works away from the body, that third figure lights up alongside the flexion band — they describe independent things, and both can apply.
Muscle use and force/load blocks
Each group has its own Muscle Use Score and Force/Load Score block, because RULA adds both to each group total separately.
The muscle use block shows the two conditions that can trigger the point, and which one fired:
- Static posture — the posture is held for longer than the configured duration.
- Repetitive action — the action occurs four or more times per minute.
Both are detected automatically; there is no manual toggle. The two groups are evaluated independently, so a task can attract the point for the arms and not for the trunk — realistic when a worker holds the trunk still while the arms repeat a cycle.
The force/load block shows which weight band applied:
| Condition | Points |
|---|---|
| Load is less than 2 kg (intermittent) | 0 |
| Load is 2–10 kg (intermittent) | +1 |
| Load is 2–10 kg (static or repeated) | +2 |
| Load is more than 10 kg, or repeated with shocks | +3 |
Tables A, B and C
All three scoring tables are shown in full, with the row and column used by this task highlighted so you can see exactly which cell produced the result.
- Table A — combines the four Group A component scores into the arm and wrist posture score.
- Table B — combines neck, trunk and legs into the Group B posture score.
- Table C — takes both group totals, each with its muscle use and force points added, and returns the final RULA score.
Seeing the cell matters more than it might sound. Because Table C is a lookup rather than a sum, the relationship between the group totals and the final score is not linear. If your Table A total sits at the edge of a band, a one-point improvement will drop the final score; if it sits in the middle, the same improvement may change nothing — and the highlighted cell lets you check that before committing to an intervention.
Table A totals of 8 or more, and Table B totals of 7 or more, are clamped to the last row and column. Beyond that point the method stops distinguishing — a task there already requires immediate change, so a worse posture cannot make the recommendation more urgent.
Average (all tasks)
When Generate averaged overview is enabled in the settings, the Posture Task Selector gains an Average (all tasks) entry showing an averaged result across every posture task. Use it only when the tasks represent the same repeated posture — averaging genuinely different postures produces a figure that describes none of them.
3 Analysis
The Analysis tab is where you go beyond the single-frame result and explore how risk evolves across the whole posture task. It is built around an interactive 3D viewer and a frame-by-frame graph.
Variable selector
RULA has more selectable measurements than the lifting reports, so the selector is split into two dropdowns: first a body segment, then a measurement within it. Changing either updates the graph, the frame insights panel and the distribution chart simultaneously.
| Body segment | Measurements |
|---|---|
| RULA score | The final score per frame. |
| Upper arm | Flexion/extension, Abduction, Shoulder raised. |
| Lower arm | Flexion/extension, Across midline / out to side. |
| Wrist | Flexion/extension, Bend from midline, Twist. |
| Neck | Flexion/extension, Twisting, Side bending. |
| Trunk | Flexion/extension, Twisting, Side bending. |
| Legs | Balance. |
Arm and wrist measurements also have a Left / Right selector, since RULA scores one limb at a time. Neck, trunk and leg measurements do not — they are whole-body and have no side.
Neither appears in the selector. Both are task-level facts computed once across the whole task rather than per-frame values, so there is nothing to plot on a timeline. They are shown on the Score Overview's Muscle Use blocks instead.
3D viewport
The interactive 3D viewer renders the motion capture data on an avatar model, constrained to the frame range of the selected posture task. You can orbit the camera freely with the mouse. The layout selector in the top-left corner sets how many views are shown — Single, Two Horizontal (stacked top and bottom), Two Vertical (side by side) or Quad — and the camera view selector in the top-right corner of each view sets what that view shows: 3D, Front, Back, Left, Right or Top. For a full overview of viewport controls and navigation, see 3D View & Interface Controls.
Score-per-frame graph
Below the viewport, a full-width graph traces the selected measurement across every frame in the posture task. The graph background is divided into colour-coded zones, and those zones come from the same thresholds the backend uses to score — so what you see on the graph never drifts from what the report calculated.
Zones fall into three patterns depending on the measurement:
| Pattern | Zones |
|---|---|
| RULA score | 1–2 3–4 5–6 7 |
| Four-band postures Upper arm and trunk flexion |
Score 1 Score 2 Score 3 Score 4 |
| Three-band postures Wrist and neck flexion |
Score 1 Score 2 Score 3 |
| Yes/no adjustments Abduction, twisting, side bending, deviation, shoulder raised |
A single boundary — below it the adjustment does not apply, above it a point is added. |
Two measurements behave differently and are worth knowing about. Flexion/extension graphs fold to magnitude, so an extension of 30° plots at the same height as 30° of flexion — except where extension carries its own rule, as it does for the neck. Across midline / out to side is plotted signed rather than folded, because crossing past the body's midline is a distinct finding rather than simply more of the same direction.
A vertical line marks the current frame position. Click or drag anywhere on the graph to scrub to that frame — the 3D viewport updates in sync. To the left of the graph are the play/pause button, speed selector, and the body risk indicator toggle, which places colour-coded markers on the avatar reflecting the risk level for the selected measurement at the current frame.
Right-side panel
A fixed panel to the right of the viewport shows sections that update as you scrub through frames.
Frame insights
Shows the value of the selected measurement at the current frame with its unit, and a visual bar divided into the same zones as the graph, with a marker showing where the current value falls. This answers "why was the score high here" for any moment, not just the peak.
Distribution
Shows what proportion of the task's frames fall into each zone for the selected measurement. It is an aggregate across the whole task and does not change as you scrub — it tells you at a glance how much of the task was spent in each risk category.
Critical moments
Critical moments are significant instants or periods in the posture task that are worth highlighting. They appear as markers on the graph and are listed in this panel. There are three types:
- Peak moment — auto-detected: the single frame with the highest RULA score in the task. Can be enabled or disabled in the RULA report settings.
- Sustained risk period — auto-detected: a consecutive frame range with the highest average score across the task. Sustained risk periods are always at least 1 second long. Can be enabled or disabled in the RULA report settings.
- Custom moments — user-created markers at a specific frame or frame range, with a user-provided description. Create one by dragging a range on the graph and clicking the Add (+) button.
Clicking a moment in the list jumps to that frame. Double-clicking opens an edit dialog to change the frame range or description. You can also drag the edges of a period moment on the graph to resize it. Both auto-detected moments (peak moment and sustained risk period) and custom moments can be edited and deleted by the user. Critical moments are included in the exported report.
Start on RULA score to find where the task peaks, then switch body segments to see which one moves with it. A frame scoring 6 might be driven by the trunk, the neck, or an arm held away from the body — stepping through the segments at that frame makes the cause obvious, and tells you which change would actually lower the score.
4 Findings
The Findings tab is a free-form documentation area where you record your professional assessment of the results. It only appears if it is enabled in the RULA report settings.
Default structure
The tab displays a vertical stack of section blocks, each with a title and a multi-line text area. If you have not customised the sections, the five defaults are:
- Current Situation
- Observations
- Risk Assessment
- Recommendations
- Conclusion
Customisation
The entire Findings structure is configurable from the RULA report settings page:
- Enable or disable the Findings tab entirely.
- Rename the tab (default: "Findings").
- Add, rename, reorder, or delete individual sections.
- Reset to the five defaults at any time.
5 Export
The Export button in the tab bar generates a complete report file. The available formats and the filename template are configurable in the RULA report settings. The exported file includes:
- All Score overview data — general information, every component score with its adjustments, the three scoring tables, and the final result.
- The Analysis data — frame-by-frame values, the score graph, distributions, and critical moments.
- The Findings content with its full section structure (if the Findings tab is enabled and content has been entered).
If Export only average posture task is enabled — which requires the averaged overview — the export contains just the averaged result rather than every individual task. For a full overview of export formats, options, and configuration, see Exporting Reports (PDF & Excel).
6 Save to Projects Database
In addition to exporting, you can save the completed assessment to the Projects Database — a persistent local library of all your saved analyses. Click Save Project in the results tab bar to open the save dialog. From there, set a project title, choose a status (Draft, In Progress, or Completed), and add optional tags for easier filtering later.
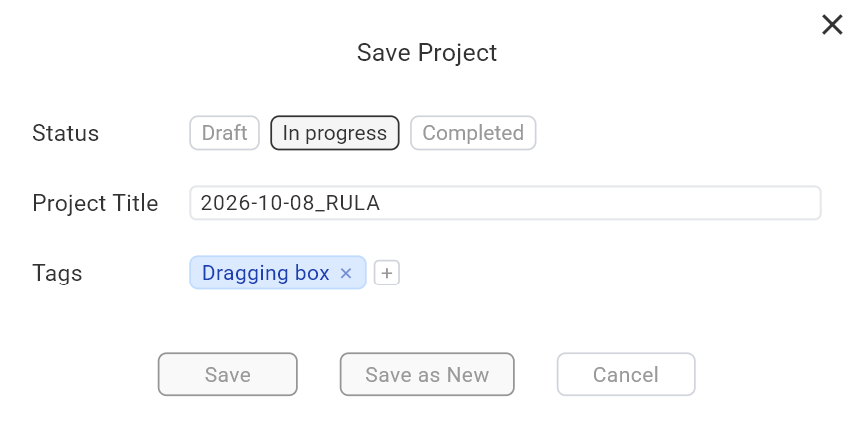
Saving a project preserves the full assessment — including all calculation data, critical moments, settings, and metadata — so you can return to it at any point. Saved projects can be reopened, re-exported with different settings, and managed from Database → Projects. See Projects Database for the full overview.