Motionprint Ergo takes a motion capture recording and produces a validated ergonomic risk assessment report — entirely on your local machine. This article walks through the workflow as you experience it in the app, from choosing an assessment method to exporting the finished report.
1 Overview
The workflow follows seven phases. Each phase corresponds to a screen or step in the application:
-
1Select an assessment method
Choose the ergonomic standard to apply — for example, the NIOSH Lifting Equation, KIM-LHC, or RULA.
-
2Provide your motion capture data
Upload a .mvnx file exported from Xsens MVN Analyze, or select a recording you made live in Motionprint Ergo. Either way, the app validates it automatically before proceeding.
-
3Configure the assessment
Trim the recording, define the tasks to analyse, and enter task parameters and metadata.
-
4Process
The backend analyses the recording locally with a real-time progress indicator.
-
5Review results
Explore risk scores, the 3D posture viewer, and findings across three result tabs.
-
6Export
Save a branded PDF report or a structured Excel export to a folder of your choice.
-
7Save to Projects Database
Store the completed assessment in your local Projects Database for future reference, re-export, or comparison.
All processing runs on your machine. No motion data, session files, or reports are uploaded to any external server. The only external communication is a periodic licence check.
2 Selecting an Assessment
The first screen in the workflow is the report selection page, where you choose which ergonomic assessment method to apply to your recording.
Three methods are currently available. The NIOSH Lifting Equation produces a Lifting Index (LI) and a Composite Lifting Index (CLI) for multi-task scenarios. KIM-LHC (Key Indicator Method for Lifting, Holding, and Carrying) maps risk to a four-level colour-coded band. RULA (Rapid Upper Limb Assessment) scores upper-body posture, muscle use and force on a scale of 1 to 7, again across four action levels.
The choice depends on what you are assessing rather than on which method is newer: NIOSH and KIM-LHC evaluate manual handling, where the load and how often it is moved drive the risk, while RULA evaluates working posture itself and applies to non-lifting work such as assembly, machine operation or screen-based tasks. Additional methods are planned and will appear on this screen as they become available.
See Understanding the NIOSH Assessment, Understanding the KIM-LHC Assessment and Understanding the RULA Assessment for a full breakdown of how each method works.
3 Providing Motion Data
After selecting an assessment method, you choose where your motion capture data comes from. The input screen offers two options side by side: upload a .mvnx file, or select a recording you made live in Motionprint Ergo.
Recording itself happens separately, before you ever reach this screen — either in Xsens MVN Analyze (for the upload path) or in Motionprint Ergo's own Record workflow. See Record Xsens Data Live to get started with live recording, or Uploading & Processing Xsens Data for the MVN Analyze export workflow.
Uploading a .mvnx file
Motionprint Ergo supports Xsens MVNX recordings — an XML-based format exported from Xsens MVN Analyze Pro. Motion data can be captured using Xsens MVN Awinda (wireless IMU sensors) or MVN Link (body suit). For step-by-step setup instructions and supported hardware configurations, see Uploading & Processing Xsens Data.
Selecting a recording made in the app
Instead of uploading a file, you can select a recording that was made live within Motionprint Ergo — captured directly from Xsens Awinda hardware through the app's own Record workflow, with no separate export step. These recordings are stored in your Recordings Database, and can be trimmed and reviewed in the recording viewer before you use them here. See .mpcap vs .mvnx Explained for how this compares to an uploaded .mvnx file.
File validation
When you upload a .mvnx file, the app validates it before allowing you to proceed. The validation checks that the file is valid, contains the required subject elements and frame rate attributes, and has at least one normal motion frame with the required position and orientation data. If any check fails, a clear error message tells you exactly what is missing or incorrect. A recording selected from the Recordings Database was already captured and verified by Motionprint Ergo itself, so no separate validation step is needed before you continue.
4 Configuring the Assessment
The input configuration screen is where you prepare the recording for analysis. There are three things to set up here: trimming the recording, defining the tasks to analyse, and entering task parameters.
Trimming the recording
Use the playbar to set the start and end of the task window you want to analyse. This focuses the assessment on the relevant movement and excludes idle time at the beginning or end of the recording.
Defining tasks
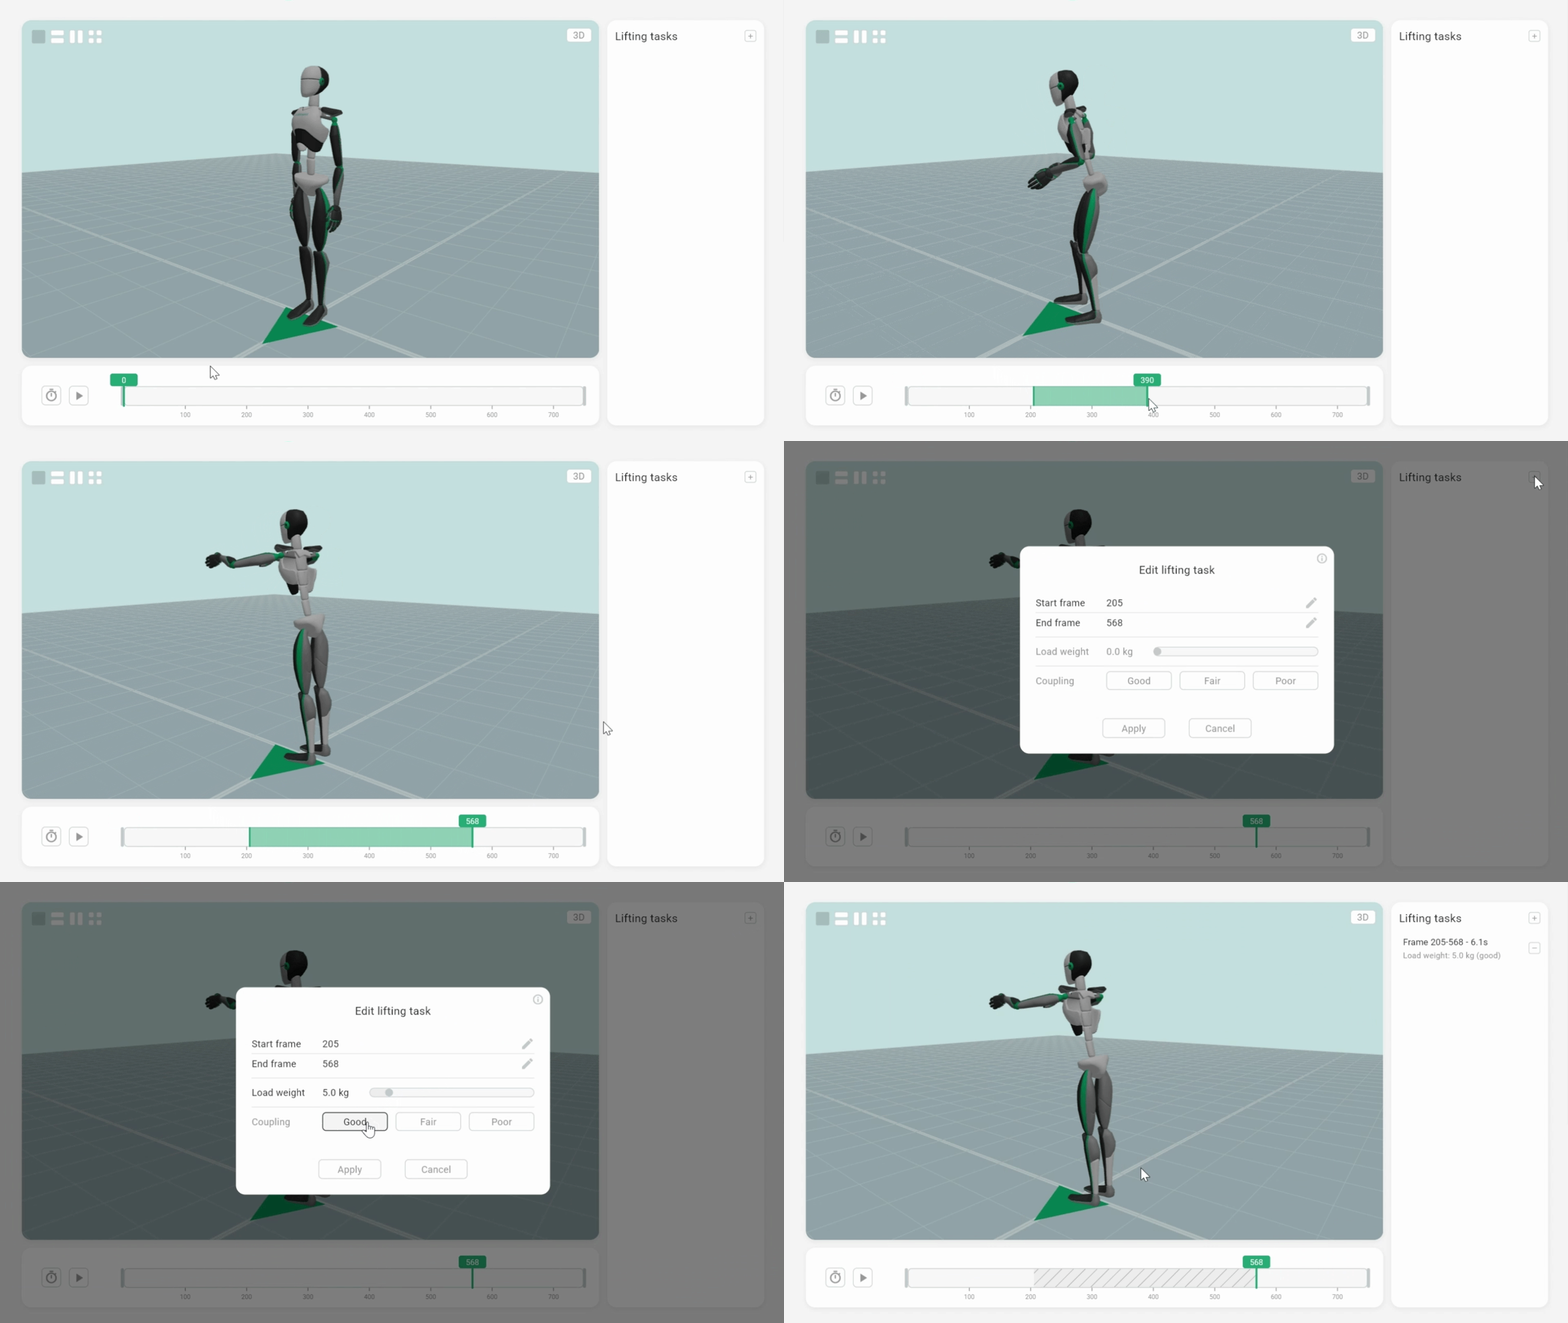
A task is a specific interval within the trimmed recording — defined by a start frame and an end frame — that represents one discrete action you want scored. The selected method determines what that action is and what the app calls it: NIOSH and KIM-LHC use lifting tasks, each covering one lift or handling action, while RULA uses posture tasks, each covering one working posture or repeated motion cycle.
You can define one or more tasks. The system analyses each separately and, where the method supports it, produces composite scores or averages across all of them. This step is also what gives peak detection its context: the pipeline identifies the highest-risk frame within each task you define.
Task parameters and metadata
The remaining fields on this screen depend on the selected assessment method. In general, you will enter task parameters such as load weight, task frequency, work duration, and body posture conditions — the exact fields vary by method. You will also enter metadata such as the workplace name, evaluator name, subject identifier, and assessment date, which appear in the exported report.
5 Processing
Once you confirm your configuration and press Process, the backend begins analysing the recording. A progress overlay appears with real-time status messages and a percentage bar, updated as each stage of the pipeline completes.
The processing pipeline extracts biomechanical variables frame by frame — segment positions, orientations, joint angles, posture deviation metrics — and then computes the risk scores for each task using the selected assessment method. All of this runs locally on your machine; no data is transmitted externally during processing.
Processing time depends on recording length and the number of tasks defined. Most assessments complete within a few seconds. The progress bar gives you a live indication of how far through the analysis the backend is.
6 Viewing Results
After processing completes, results are displayed across three tabs. Each tab surfaces a different layer of the assessment output.
Tab 1 — Score Overview
The Score Overview tab presents the results in the same structure as the manual version of the selected assessment method — the way an assessor would traditionally fill it in on paper or in a spreadsheet. Each variable, multiplier, and sub-score is laid out as it appears in the official method, so the output is immediately familiar and auditable. The headline risk score is mapped to a colour-coded risk band with clearly defined thresholds and recommended actions. When multiple tasks are defined, composite or aggregated scores are shown alongside the per-task breakdown, where the method supports it.
Tab 2 — In-Depth Analysis
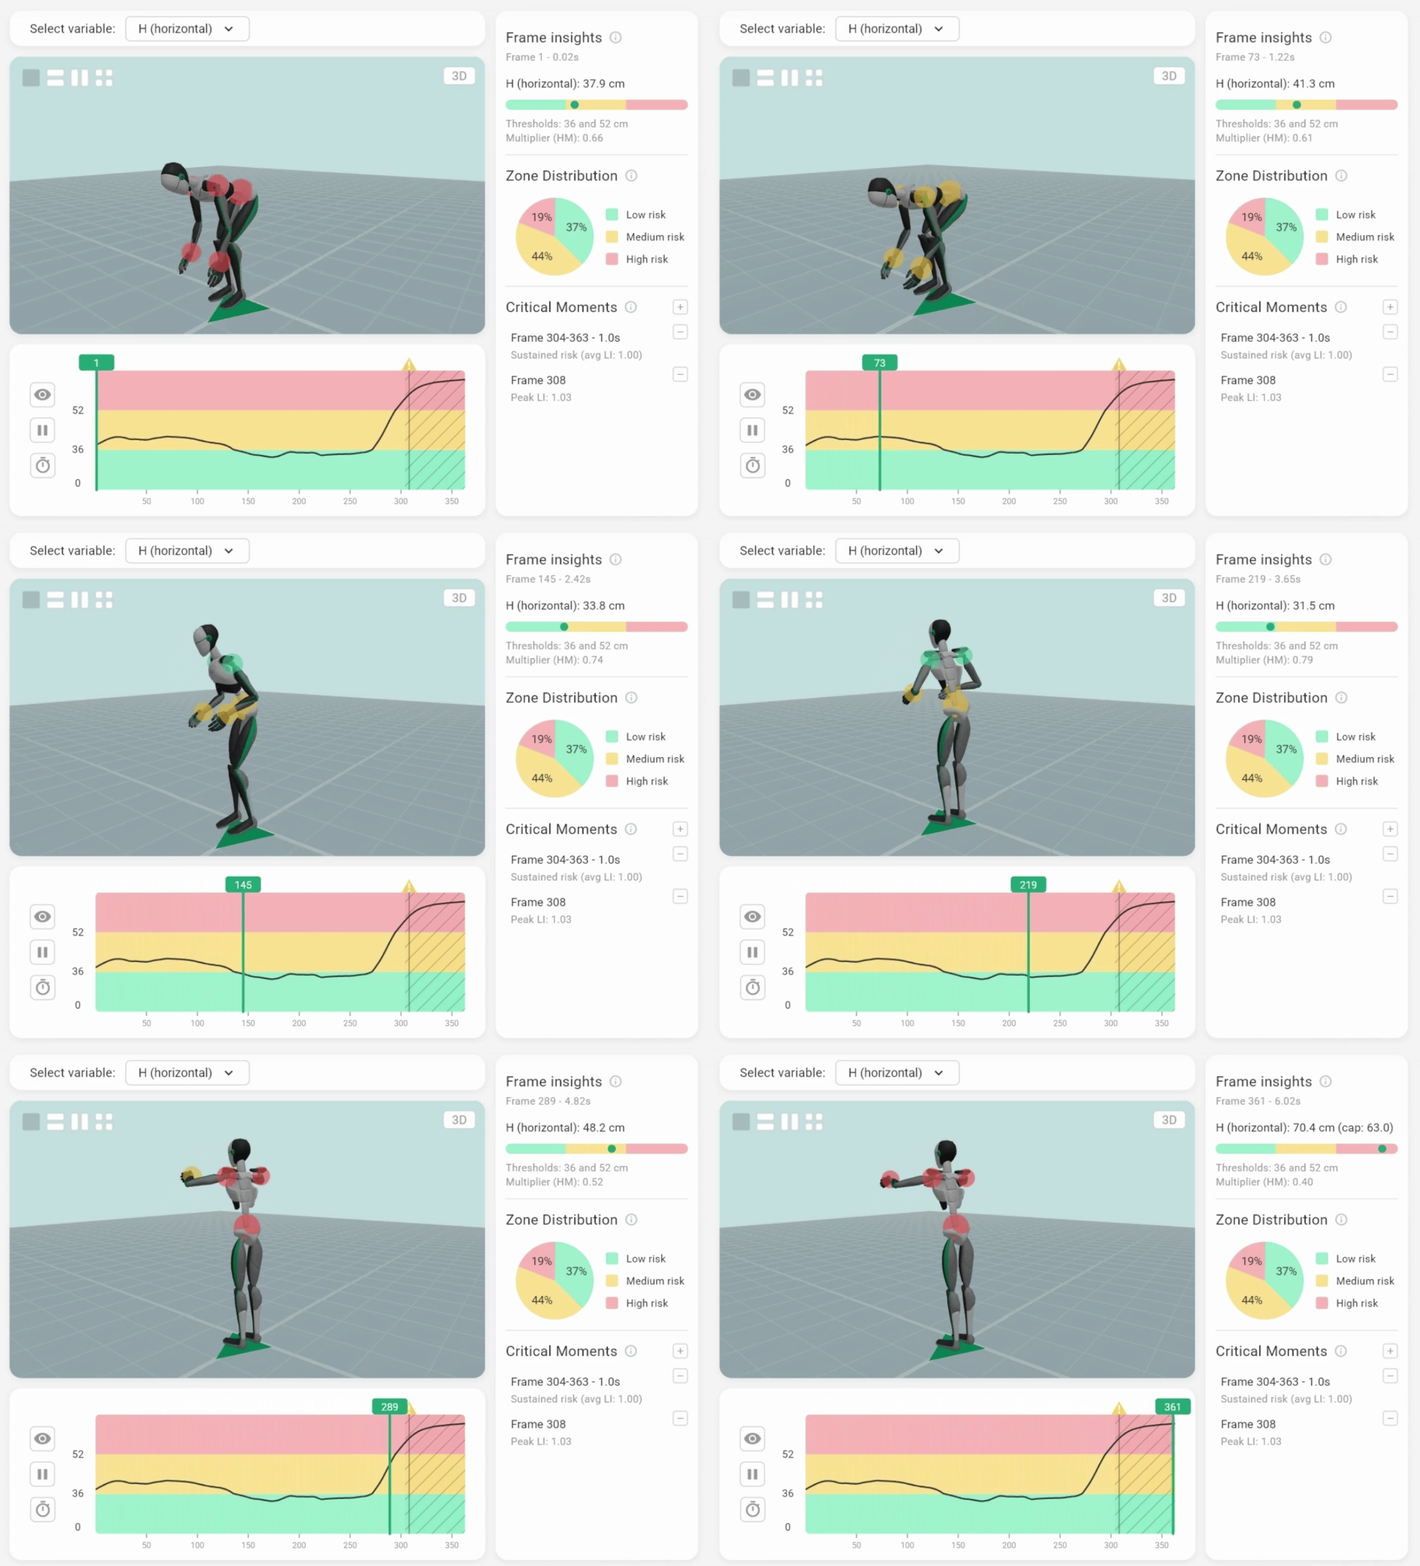
The In-Depth Analysis tab is built around a 3D avatar viewer. The avatar plays back the worker's exact posture frame-by-frame, animated from the motion capture data. A risk score graph is displayed alongside the avatar and stays in sync — so as the avatar moves through the recording, the graph highlights where in the task the risk was highest.
Playback controls let you play, pause, adjust speed, and jump to any frame manually. You can also switch the viewport between the different tasks you defined, inspecting each one independently. This makes it straightforward to explain a specific finding — such as an asymmetric peak load or an awkward reach — to a worker or a client in concrete visual terms.
Tab 3 — Findings
The Findings tab presents the assessment's recommendations and observations in a structured format suitable for inclusion in a client report. The content and visibility of this tab can be configured in the app's report settings — it can be toggled off if you prefer a results-only output.
7 Exporting Reports
Once you are satisfied with the results, you can export the assessment in PDF or Excel format — or both.
PDF report
The PDF export is a fully formatted assessment document ready to share with clients, H&S managers, or regulatory bodies. It includes the headline risk score, a breakdown of contributing risk factors, findings and recommendations, and embedded 3D posture screenshots from the In-Depth Analysis tab. Your organisation's branding — logo, accent colour, and company name — is applied automatically based on your settings in Settings → General. See Customization & Branding for setup instructions.
Excel export
The Excel export provides structured data with colour-coded risk levels, making it straightforward to compare results across assessments, build trend charts, or feed data into an existing H&S management system. Like the PDF, it includes embedded 3D posture screenshots alongside the tabulated score data.
Saving and filenames
When you export, the export dialog lets you choose the format, the file name and exactly where to save the file. The app remembers the last-used folder for each report type and format. Export filenames follow a customisable template — for example, {workplace}_{current_date}_{report_type} — which you can configure in report settings. See Exporting Reports (PDF & Excel) for the full list of available variables and options.
8 Saving to Projects Database
In addition to exporting, you can save any completed assessment to the Projects Database — a persistent local library of all your saved analyses. Click Save Project on the results screen to store the full assessment, including calculation data, settings, and metadata. Saved projects can be reopened, re-exported with updated settings, filtered by method or status, and organised with tags. See Projects Database for details.